Sales Performance Dashboard

Introduction
This project case is about a car distributor company who wants to make a dashboard website to see the sales performance since the start of its business until the last day of 2020. They want to see how much revenue they have up until the last day of 2020, what's the top selling car, product availability, and the details of revenue such as monthly revenue or yearly revenue. The first thing you should know is when I got this project, I haven't had complex knowledge about HTML, CSS, and JS. I even don't know yet about bootstrap or any other library that can help me creating website design. In fact, at that time I was just beginning learning the fundamentals about HTML, CSS, and JS.

Concept
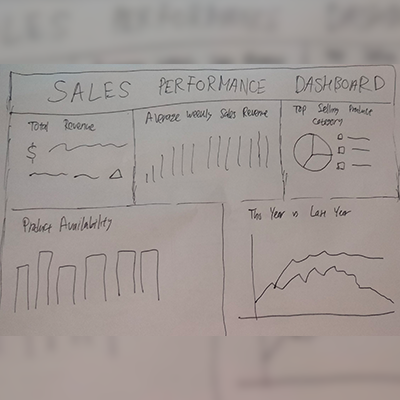
In this project I didn't do all tasks by myself. I have a team to work with and the first concept of dashboard design was made by my teammate. The first look of the dashboard website was sketched manually. There's 5 main element that we are going to show such as Total Revenue, Average weekly sales revenue, Top selling product category, Product availability, and revenue comparison between 2 different year. The type of charts are mostly already defined, but some are not. And about the data that we will use to be visualized in the dashboard, we decided to make data dummies which was created with Mockaroo and exported into .csv file.
Implementation
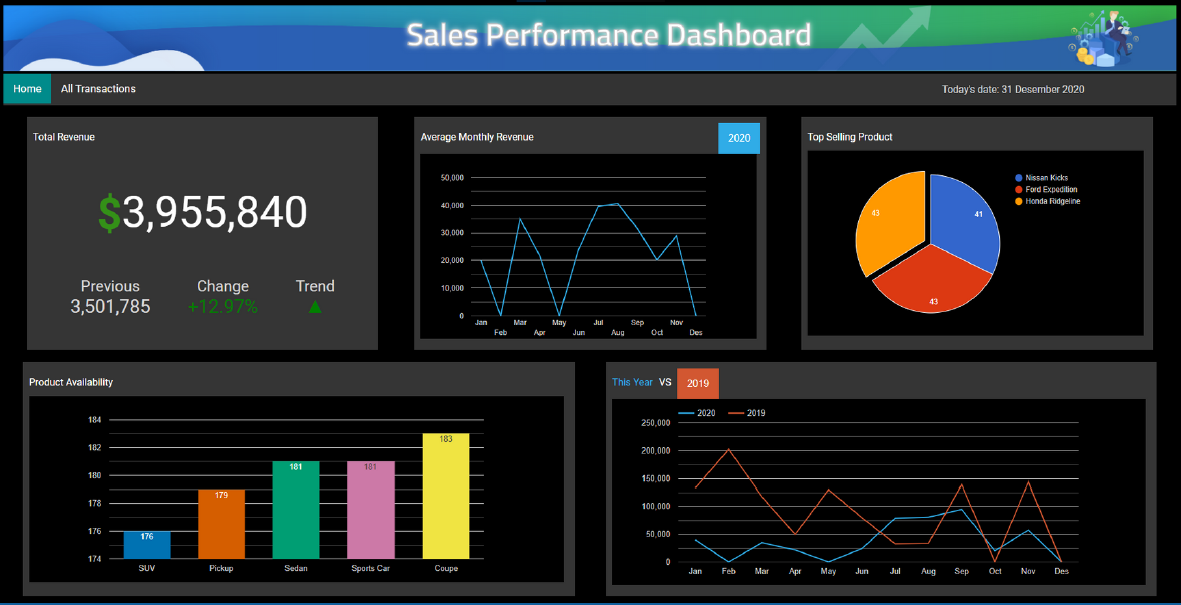
The implementation part was very hard for me since I didn't have much knowledge about using HTML, CSS, JS, and even Google Charts. I spent hours staring on my monitor trying to configure how to make an object behaves just like what I wanted. But I don't regret those moments because that's a process I have to face to be a better programmer. And in the end, I managed to create the dashboard although it is still very old fashioned and not that dynamic. There are some charts that can be filtered with the year such as This Year(2020) vs (2019/2018/2017/2016) and the Average Monthly Revenue (2020/2019/2018/2017/2016). And every changes made, an animation will show up.